How to read and understand an ONA
By Line Bloch, 19. February 2020
When analyzing a organizational network diagram, you look at both the overall structure, shape and density, but also on the roles people holds.Who bridges the gap between silos and who binds the units together? Do teams work together across the organization, or do they keep most to themselves?
At first glance, an organizational network diagram is often difficult to read and understand. Here’s a brief review of the things you can look for, to make sense out of the tangle.
What types of structures are we looking for?
We only use active data when we do the analyses. Active data is data collected through a questionnaire for this specific purpose. It gives the freedom to tailor the questions for the exact purpose. Since our focus often is on collaboration and culture, this is what we are asking questions about – but you can ask for almost anything else. Once at a seminar, we examined how good options the participants have had to network during the seminar, by simply asking who of the other participants they know at the beginning of the event, and then asked again at the end of the seminar. Another option is to ask for role models. By this, you might can gain insight into a possible talent port.
Learn more about active and passive data and the process of performing an ONA here.
But how do you read an organizational network diagram? Overall, we look for these parameters and structures:
- The shape and density of the network
- Groupings and any silos
- Important roles: bonders, bridgers and peripherals
- The difference between the social and professional networks
The shape and density of the network
The first thing we’re looking for, is if there is one connected network or several ‘islands’. The vast majority of network diagrams are coherent, in which all respondents directly or indirectly are connected to each other. Translated to the everyday life of the organizations, it gives information about if the units in your organization is connected, or if there are units, that work completely separated from the rest. We very rarely observe this. In organizations where you do work very siloed, most often there is coherence at management level.
An organizational network diagram usually has a round or elongated shape. The rule of thumb is, that the more around the more connected the cooperation in the organization. And vice versa: the more elongated the more distributed they work.
The density of the network also provides good information. In an organizational network diagram, the density consists of the number of relationships e.g. how many other people have each person chosen to point at. The simplest way to assess the density is using the average outdegree. Outdegree is the number of people, each person has pointed at.
If each person can point to a maximum of 10 people in the questionnaire, it gives a good insight if 3 or 7 has been selected. We see both. An organization that works closely together and has a strong internal network often has an average outdegree of over 7.
A thinner network is not necessarily bad. An organization made up of specialists who need to work focused, can be most effective if each employee has relatively few to interact with in day-to-day work.
Geodesic Distance
Geodesic distance is the shortest way from someone in the network to another. I.e. if you go from relation to relation to how many people do you need to go through, to reach a given person. The average geodesic distance therefore indicates how close the organization is. The lower the number, the closer related the organization. Translated to daily life it provides information on how well you know each other across the organization. The same type of number is called the Kevin Bacon number, i.e. how many handshakes are you from Kevin Bacon.
Groupings (silos)
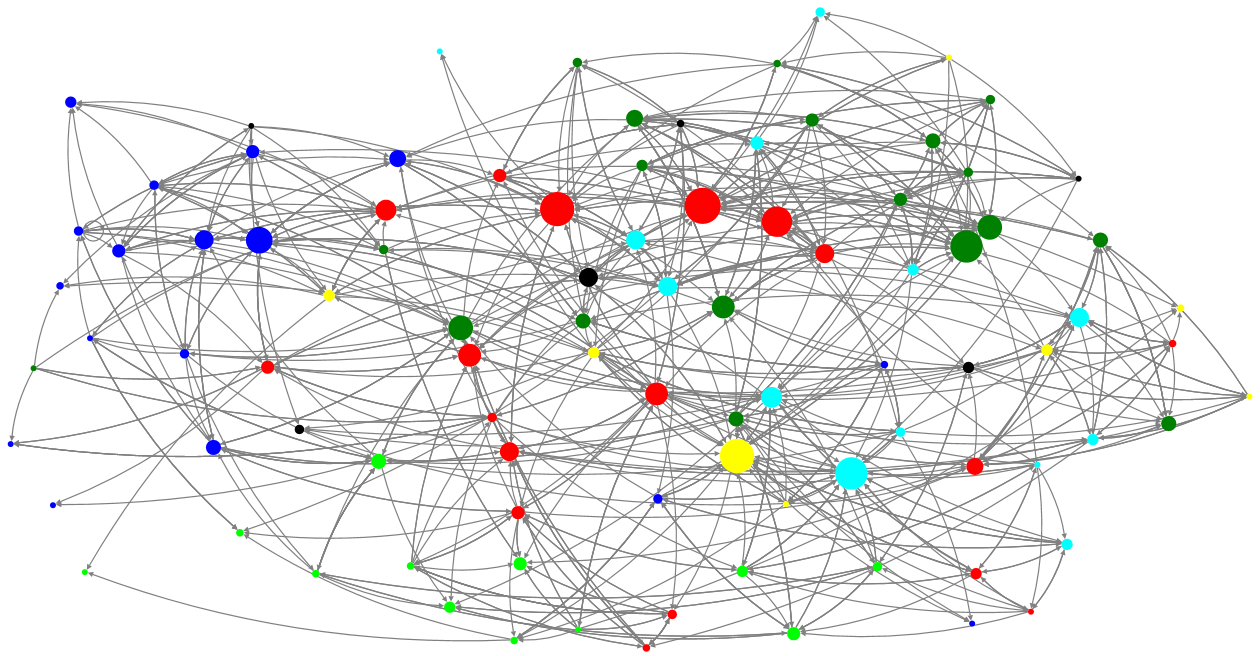
Grouping is a closely related gathering of people in the network, visibly separated from the rest of the network. It can be employees from the same department, same location, or having same role. The extent to which a grouping is a silo or not, is typically determined by the homogeneity of the grouping. Is it only people from one department, or is it a mix of multiple departments? On the figure each color indicates a department, and here it is clear to see the silos.
Important roles in the network diagrams
Although an ONA is much about the overall patterns, people who play important roles in the organization can also be identified. We can point out bonders, bridgers and peripherals.
Bonder
A bonder is an employee who is centrally located in a grouping and has relationships with most of the people in the group. You can identify them by having many relationships, and therefore their dot is greater than the others.
Bonders are typically the ones who ties a group together. They have a supportive and coordinating role, and act as the “social glue”, i.e. it is them people gather around, often go to when they have issues to discuss.
If all employees in a group have equal numbers of relationships, there is no clear bonder
Bridger or connector
The people who interlink silos with each other are called bridgers or connectors. They are characterized by being the link between groupings on the diagram. A bridger often has many relationships on either side of the grouping and is located on edge of the grouping and never in the middle.
The function of bridge builders in the organization may be to be a communication link between two entities. They may have an important function as ” shield” for a department that needs not to be disturbed, but it may also be that they act as bottlenecks for knowledge or communication.
Peripherals
In some networks there are often people ‘floating’ peripherally on the fringe of the network. It’s employees who may be part of the organizational network on the paper, but not really in action. If the peripherals holds important knowledge, it is critical to have them attached closer to the rest of the organization.
If it is a newly hired employee, it is often input to if the onboarding is effective. If it’s employees who have been employed for years, insight into the person’s role and function can clarify if it’s ok or if he is about to leave the company.
A person can also appear peripheral, if she has strong relationships with people outside the organization. It can be customers, external project partners or collaborators. Often these external connections are important for the organization, so in these cases it is of course both positive and natural to appear at the edge of the diagram.
It is worth remembering that from the network diagram alone, you cannot interpret whether a pattern is positive or negative, it all depends on the context. We can only see that people play a role and that they have an impact in the network.
The difference between the social and professional networks
We often compare two different types of networks with each other, to spot the state of an organization. The professional network is made out of information about who works together and who uses each other for professional sparring. It tells about the cooperation, how good you are at sharing knowledge, and how good you are at using the relevant people in the organization. The social network is based on answers to questions about who gives energy and motivation, and who they are is talking about non-professional things. It gives insight into how much you relate to each other. Based on an organizational network diagram alone, we can give a pretty good idea of how good the mood is in a project.
Relationships beat skills when it comes to how good and productive a collaboration is. Is the social network much alike the professional it is indicative of an organization that works homogeneously and is more resilient. The reverse applies if there is a big difference between the two networks. If the social network is grouped according to where people sit and who they were in team with once a decade ago, it may be a sign that the cooperation in projects and teams do not have their full potential.
Interpretation and explanation
You can read a lot from an organizational network diagram. The full analysis and insight into if an observation is positive or negative, will always require insight and knowledge of roles and people in the organization. Therefore the organization and the management in particular, must always must be an active part of the dialogue on causation on the network diagram.
Want to know more?
Send me an email
and I’ll get back to you!
Get free, useful tips and tools
that will help you navigate the future
and enhance your leadership already today
Do you want to make a deep dive?
Visit our learning paths with the
newest content – it’s all free!


